The banking sector has always attracted a lot of attention in the global markets and is usually the sector under maximum analyst coverage. However, analyzing banking stocks isnt easy. There are many aspects of evaluation unique to banking especially when it comes to revenue sources. Banking, a service industry, has conventionally depended on interest income for its profits. However, with the advent and rise of investment banking, the current banking industry must be studied under the light of both: interest as well as non-interest-based income and expenses.
In the past, we have studied concepts such as share-based compensation, operating lease, unfunded pension liabilities, other comprehensive income, etc. for the S&P 100/500 companies. But this time around, we are focussing on industry-specific studies, starting with banking.
To power this study, we analyzed the top 10 US banks (based on their assets as on March 31, 2016) with the help of our analytical tool and compared some key financial ratios.
The ratio of Revenue to Compensation per Employee for the Top 10 US Banks.
The first ratio that we used to compare these banks is the ratio of revenue to compensation expense per employee. This ratio highlights how many times the revenue covers the expenses for each employee. The higher the ratio, the better it is.
For the number of employees, we used the figures from the MD&A (Management Discussion and Analysis) of the 10-K filings of the respective companies. An average of the opening and closing balance was considered to provide a realistic picture.
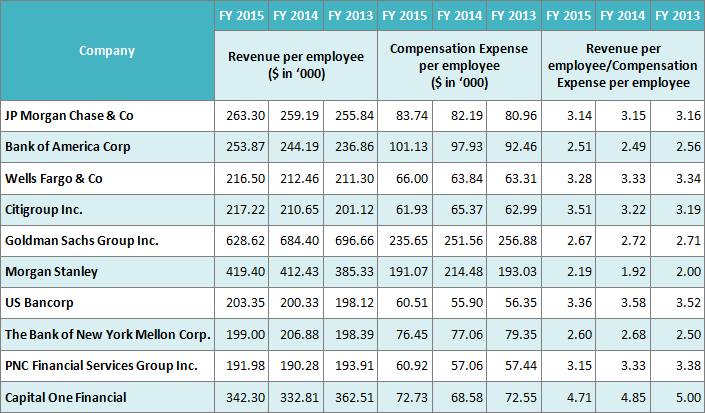
Table 1: Revenue to Compensation Expense Ratio per Employee for Top 10 US Banks (as per their assets as of 31st March 2016) for FY2013-2015
While the table above shows only the derived value, you can see details of revenue, compensation expense, number of employees, and average number of employees in the attached spreadsheet: Banking Revenue and Compensation Details
On an absolute basis, for FY15, Goldman Sachs has the highest revenue per employee ($628,620) while PNC Financial Services has the lowest revenue per employee ($191,980). However, Goldman Sachs also has the highest compensation expense per employee whereas PNC Financial Services has a low compensation expense per employee. PNCs compensation expense per employee is lower than that for all other banks barring US Bancorp.
However, the clear leader when it comes to the ratio is Capital One Financial. Its revenue per employee is amongst the highest for all banks while its compensation expense amount is among the lowest for all banks. This gives it a revenue-to-expense ratio of 4.71 which is 120 basis points higher than that of Citigroup, the runner-up.
Morgan Stanley has a revenue-to-expense ratio of 2.19 which places it at the bottom of this list.
Bank of America Corp, The Bank of New York Mellon Corp, and Goldman Sachs are the other banks that have low revenue-to-expense ratios while a majority of the banks have values over 3.
A similar trend is seen for FY14 and FY13.
Does this have anything to do with the type of services the bank provides?
Goldman Sachs is primarily an investment bank where revenue per employee is quite high when compared to a conventional bank. Likewise, the compensation expense per employee is also quite high for investment banks when compared to conventional banks. Thus, a lot of the variance in the ratios of various banks can be attributed to the model of the banking company: conventional or investment banking.
A Study of Income vs Expense for the Top 10 US Banks
Banking companies usually report 2 main categories each for income and expenses – interest and non-interest.
Interest Income includes the interest earned from loans and leases, investment securities, federal funds sold, securities purchased under agreements to resell, investments in banker’s acceptances, commercial paper, certificates of deposit, dividend income, or other investments.
Interest Expense amount represents the interest on deposits from customers, borrowed funds, trading liabilities, etc.
Non-Interest Income includes fees and commissions, premiums earned, gain (loss) on the sale or disposal of assets, and any other income that cannot be categorized as interest income.
Non-Interest Expenses mainly consists of salaries, wages, other employee benefits, professional fees, occupancy expense, selling, marketing, and other general and administrative expenses which are not categorized as interest expense.
We then looked at the percentage of interest income to total income for every bank.
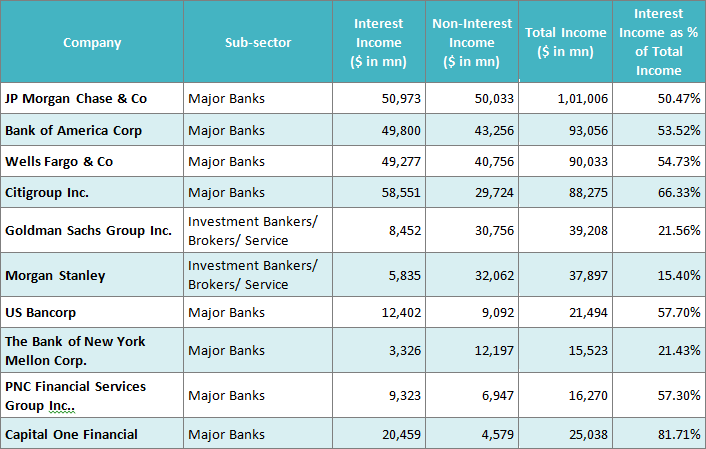
Table 2: Interest Income as a Percent of Total Income for Top 10 US Banks (as per their assets as of 31st March 2016) for FY2015
Data about FY 2014 and FY 2013 is available in the attached spreadsheet: Banking Interest Income to Total Income
Capital One has a high-interest income to a total income percentage of 81.71% for FY 2015. Citigroup is at 66.33% while US Bancorp is at 57.70%. One can infer that these are conventional banks and hence they earn much of their income from interest.
Likewise, the banks that have the lowest percentage are Morgan Stanley (15.40%), Bank of New York Mellon (21.43%), and Goldman Sachs (21.56%). These banks earn much of their income through investment banking, fees, and commissions, premiums, sale of assets, etc.
In our next article, we will analyze these 10 banks in more detail by looking at the composition of interest income, interest expense, and deposits for FY 2015.