While banking companies always make the news, for those looking to invest or analyze them, it’s not as easy as companies from other industries. But you needn’t fret if you are armed with our nifty analyst’s guide to banking stocks.
We have been analyzing the top US companies for key metrics such as share-based compensation, operating lease, unfunded pension liabilities, other comprehensive income, etc. for the S&P 100/500 companies so that analysts can get better insights on company performance. But we’ve just kicked off our industry deep-dive with the banking sector. In my previous article, we looked at how investment banks differ from conventional banks in terms of income composition. To analyze the top 10 banks (based on their assets as on March 31, 2016) in more detail, I will focus on the composition of interest income, interest expense, and deposits for FY 2015.
Interest Income Composition
Let me start with the Interest Income Composition for these banks for FY 2015.
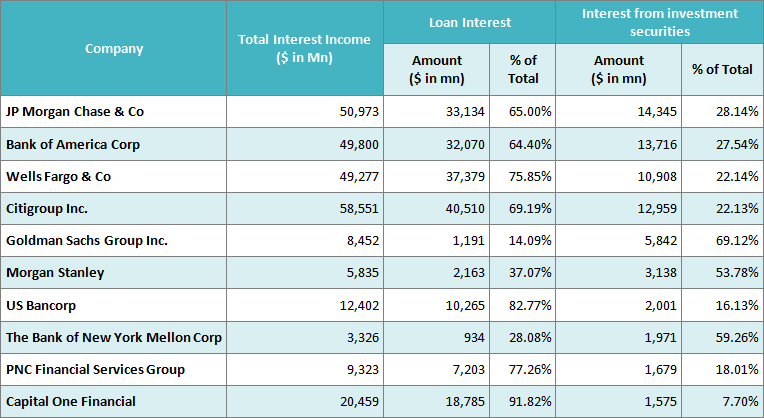
Table 1: Interest Income Composition for the top 10 US banks (based on their assets as on March 31, 2016). Additional details on other interest incomes and data for FY 2014 and FY 2013 are available in the attached spreadsheet.
Capital One gets 91.82% of its interest income from interest on loans extended. For US Bancorp this percentage is 82.77% and for PNC Financial Services the percentage is 77.26%. This is typically how a conventional bank would function.
On the other hand, Goldman Sachs gets just 14.09% of its interest income from loan interest. For Bank of New York Mellon, the percentage is 28.08% and for Morgan Stanley, it is 37.07%. In line with their expertise in Investments which would imply an active treasury, these three banks earn a large percentage of their total interest income from interest on investment securities. For Goldman Sachs, this percentage is 69.12%, for Bank of New York Mellon it is 59.26% and for Morgan Stanley, it is 53.78%.
Interest Expense Composition
Let us now look at the Interest Expense Composition for these banks for FY 2015.
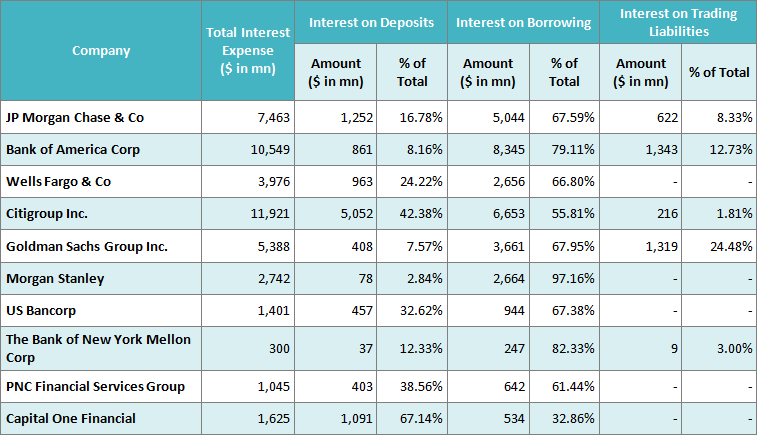
Table 2: Interest Expense Composition for the top 10 US banks (based on their assets as on March 31, 2016). Additional details on other interest expenses and data for FY 2014 and FY 2013 are available in the attached spreadsheet.
For a conventional bank, interest on deposits would comprise the largest portion of their total interest expense. Capital One, is 67.14%. On the other hand, for Morgan Stanley, interest on deposits constitutes just 2.84% of its total interest expense. For Goldman Sachs as well, interest on deposits is just 7.57% of its total interest expense. Considering its investment banking and securities background, it comes as no surprise that the interest on borrowing component comprises 97.16% of Morgan Stanleys total interest expense. For Goldman Sachs, interest on borrowing and interest on trading liabilities together constitute 92.43% of its total interest expense. For Bank of America, it is 91.84%.
Deposit Liabilities Composition
Lastly, we look at the breakup of deposit liabilities by interest-bearing and non-interest bearing for FY 2015.
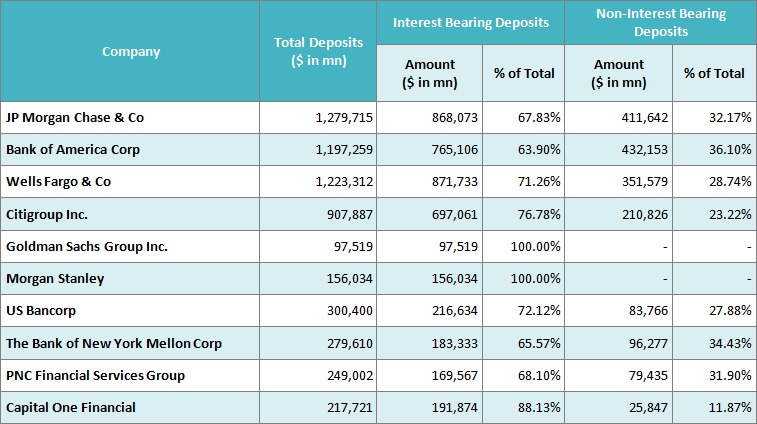
Table 3: Deposit Liabilities Composition for the top 10 US banks (based on their assets as on March 31, 2016). Data about FY 2014 and FY 2013 is available in the attached spreadsheet.
Goldman Sachs and Morgan Stanley are investment banks that have turned into commercial banks. Hence they do not have any non-interest-bearing deposits. Capital One to has just 11% of its total deposits in the form of non-interest-bearing deposits. On the other hand, non-interest-bearing deposits comprise 36.10% of total deposits for Bank of America while for Bank of New York Mellon and JP Morgan Chase, it is 34.43% and 32.17% respectively. Non-interest-bearing deposits are typically checking accounts and it could reduce the cost of deposits for such banks.
To conclude, banks are complex entities and it would not suffice to analyze them merely based on standard data points such as net interest margin, loan to assets, return on assets, etc. It could help to look at some of the other ratios/parameters that we have looked at in this article. Analyzing these data points that are specific to banking can give one a fair understanding of a banks performance, its sources of funding & income, and its employee efficiency factor. This could even help you prepare a suitable investment strategy for this sector.
Though analyzing these numbers can seem difficult due to the time spent in aggregating rather than analyzing data, analytics solutions like iConnect can make your task much easier.
iConnect is an MS®Excel® based add-in that provides you access to a repository of publicly available XBRL data that you can download directly into spreadsheets. With iConnect, you can focus on analyzing financial data rather than aggregating it from disparate sources. The application also allows analysts to add textual commentary to any report to provide additional insight and guidance.