Crude oil prices plummeted 46% (Nymex) in FY 2014 followed by another sharp drop of 30% in FY 2015. In short, over these two years, oil prices lost 62% of the price prevailing at the end of 2013, owing to burgeoning US shale oil production, a slow Chinese economy, and an intransigent OPEC that refuses to cut production. We recently covered the effect of plunging oil prices on banking stocks, and are digging deeper to cover shale oil companies in this story.
A PwC report of 2013 estimated that an increase in US shale oil production could reduce oil prices in 2035 by around 25%-40% ($83-$100/ barrel in real terms) relative to the then baseline EIA (US Energy Information Administration) projection of $133/barrel in 2035. But no one expected to see a situation that was not only far worse but also too close for comfort, arriving in 2015 itself at $30/barrel.
We studied the recently filed annual 10Ks of shale oil companies, and the study powered by our data platform, Cleandata, brings out some interesting insights – A sharp rise in impairment charges and a decrease in capital expenditure.
Are shale companies in the throes of financial turmoil? Let’s look at what we found.
A steep rise in impairment charges on oil and gas properties
Shale companies that were churning out enormous oil outputs in better times are today recording high impairment charges on their oil and gas properties.
Out of the 15 companies covered, 13 show higher impairment charges in FY 2015 when compared to the previous two years. The impact of this could have been considered less important, had there been no material change in the earnings. However, the study shows that all 15 companies reported a reduction in their retained earnings with 4 companies having negative net retained earnings.
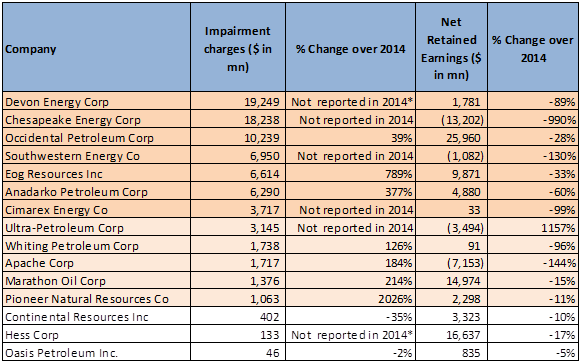
* Company reported impairment charges in 2013 but not in 2014.
Figure 1: Trend analysis for Impairment on Oil & Gas properties and Net Retained Earnings in 2015
Remarkably, the three worst-performing companies in terms of share price in the year 2015 Chesapeake Energy, Southwestern Petroleum and Ultra Petroleum had not provided for impairment charges for financial years 2013 and 2014. The stock market appears to have been spooked by the late provisioning last year. These 3 companies then lost between 74% & 81% of their share price in just one year. Overall, in the 2 years, share price erosion for the 15 companies has ranged from -11.72% (Cimarex) to -88.28% (Ultra Petroleum).
Cuts capex and looks to pare it further in 2016
Typically, an oil & gas exploration and production company incurs heavy capital expenditure on discoveries or towards enhancing production. Hence, a healthy company report usually has high capex attribution. However, in 2015, the gross cash outflow for capital expenditure shows a sharp decline for all the companies studied. What is more alarming is that the declining trend is expected to continue this year as well looking at the companies’ forecasts of capex for FY2016.
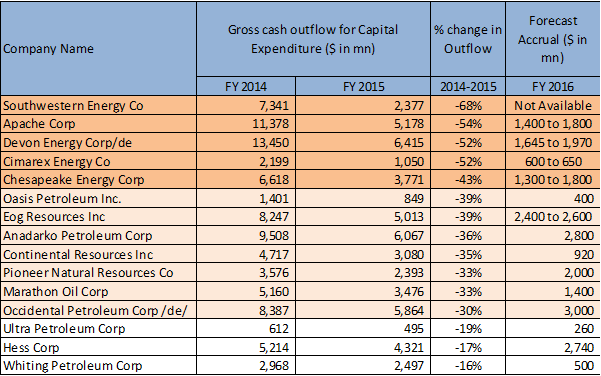
Figure 2: The gross amount of cash outflow for Capital expenditure in FY14 & FY15 and forecast for FY16
In the last two years, as many as 10 companies have seen share price erosion of 50% or worse. Hence they may not want to raise equity capital at depressed prices. Additionally, investors too are likely to stay away considering the negative factors affecting the sector. The majority of the companies increased their exposure to debt in FY 2015 and this could adversely affect their current year’s resource mobilization efforts.
The consensus appears to be that oil prices are likely to remain low or only have a weak recovery this year. In such a situation, the balance sheets of these companies will continue to remain under stress this financial year as well.
All in all, we see another challenging year on the cards for oil companies in general and shale oil companies in particular.