Financial analysis involves evaluating a company’s current and past financial data to estimate and predict future performance. Analysts, as and when they gather data required for analysis, typically rely on the financial reports filed by companies with regulatory agencies. Then they go on to look at the company’s numbers independently and also in comparison with that of industry peers for benchmarking. But in discussions with analysts, we have found that most of the analyst’s time is spent on aggregating data rather than analyzing it.
What is it about the data aggregation process that makes it so tedious?
Let’s assume we are speaking of publicly listed companies in the U.S. that file with the Securities and Exchange Commission (SEC), in HTML and XBRL formats. While HTML data is certainly easier on the human eye, XBRL data is machine-readable and can be extracted easily for analysis. Some of you prefer to eyeball the numbers of the HTML document and manually copy-paste them into your models, while others download the reported XBRL data directly into spreadsheets. No matter what method you use, there is one problem you cannot do away with – the non-standardization of data. Non-standardization exists in different ways in different formats.
Let’s try and understand this a little better.
Challenges with the Use of HTML Data for Analysis of SEC Filings
In accounting, there can be different ways of presenting the same information. This often leads to the same accounting concepts being called differently by different companies. And while this is usually not an issue for the human mind to process, it starts posing problems when you put all the data into your spreadsheet for comparison purposes.
To illustrate this, let’s take the example of the following five technology companies and how they report some key reported concepts: Facebook (FB), Intel (INTC), Texas Instruments (TXN), Microsoft (MSFT), and Apple (AAPL).
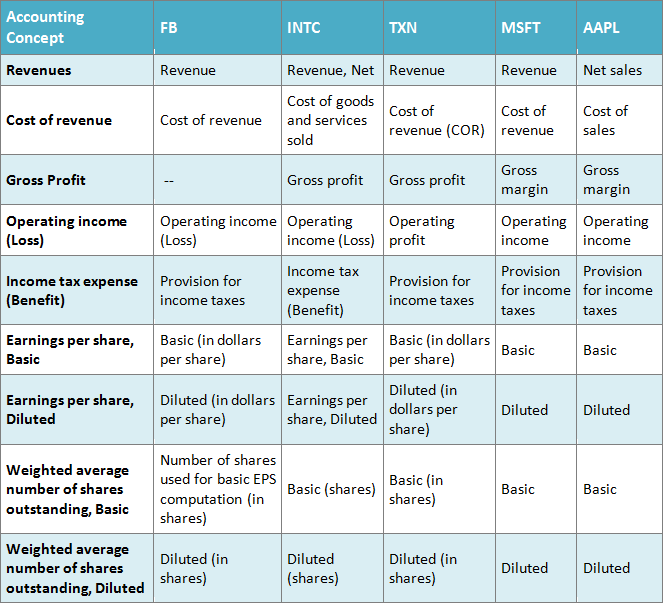
Table 1: Different Names of the Same Accounting Concepts Used by Companies of the Same Sector
As you can see, companies tend to use different terms for the same accounting concept. Revenues are termed Revenue by Facebook, Texas Instruments, and Microsoft while Intel prefers to call it Revenue, Net, and Apple – Net sales. What seems like a minor semantic difference causes analysts to spend a lot of time sifting through company documents, trying to match terms and extract comparable information.
Now let’s see if XBRL data can solve this problem of non-standardized data across companies.
Challenges with the Use of XBRL data for Analysis of SEC Filings
XBRL provides the facility of having ‘element names’ and ‘labels’ within the data. While an element name is used by filers to tag a value to an accounting concept, a label can be used to give it a preferred display name. Thus, a filer can tag the company’s revenue to element name Revenues but label it as any one of Revenue, Net, Revenue, or Net Sales.
So, it would seem that the issue faced with the use of HTML data should get resolved with the use of XBRL data instead.
Well, not really. And here’s why.
For concepts such as Gross profit, Operating income (loss), Income tax, etc. there are standard elements in the US-GAAP XBRL taxonomy. But there are other elements such as Revenue, Cost of sales, and Selling general and administrative expense, etc. where XBRL offers the ability to capture information at varying levels of granularity.
Therefore, despite referring to similar concepts, companies tend to use elements that are more specific to their reporting needs. This compromises the standardization and comparability due to the use of different elements to define what could be attributed to a common element with different labels for all companies.
Let us once again use data from the same set of companies to illustrate this. Here’s an extract from iConnect, our Excel add-in for analysts, of the XBRL data for FY 2015.
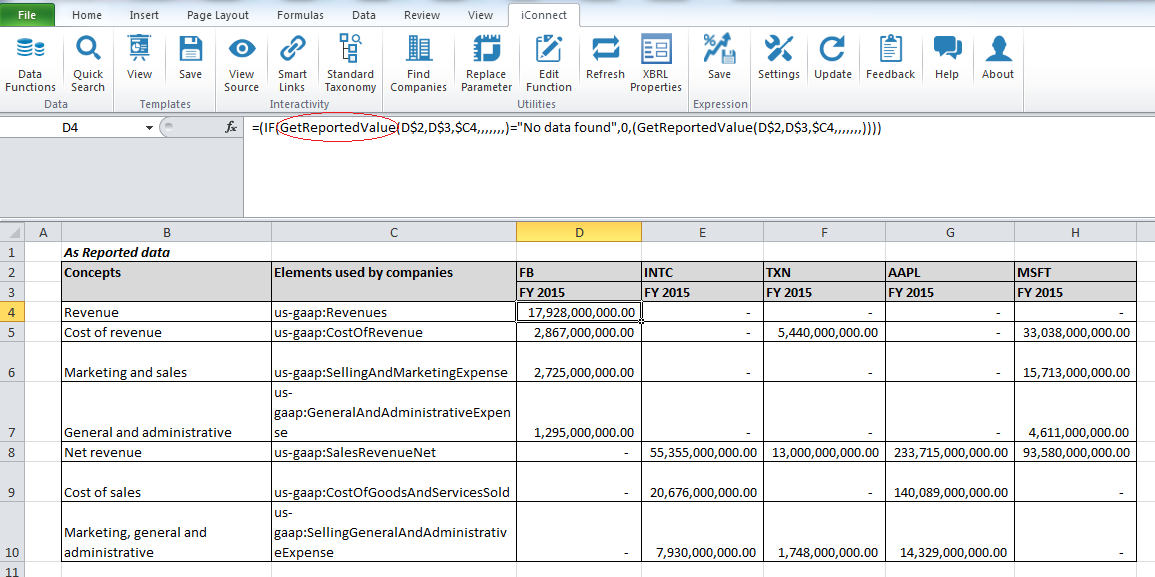
Table 2: Extract from iConnect of Data Reported for Similar Accounting Concepts
It is evident from the image above that Facebook uses the element Revenue to tag its revenue numbers while the other companies tag this to Net Revenue which is nothing but Revenue adjusted for any price reductions/refunds. Similarly, Facebook, Texas Instruments, and Microsoft have tagged data to the element Cost of revenue, while Intel and Apple prefer to be more granular, tagging their numbers to Cost of sales instead. Additionally, Facebook and Microsoft have provided granular information on Marketing & sales expense and General & administrative expense whereas Intel, Texas, and Apple have only reported Selling, general and administrative expenses as a combined figure.
So there seem to be clear limitations while using as-reported XBRL data as well. ( Read our post here on another such limitation of XBRL Data Dont let Extensions Get in the Way of Your Company Analysis)
What then is the holy grail of data standardization and comparability?
Using Normalized Data for Analysis of SEC Filings
The answer to all your woes at least as far as they relate to standardization might be in normalizing data. At IRIS, we have prepared an additional normalized XBRL taxonomy that is based on the US-GAAP taxonomy but has been modified to standardize the reported data of SEC filings. In the normalization process, we club similar elements and define their relationships with each other. We also use calculations to derive the values for important concepts. Thus, the normalized XBRL taxonomy captures in-depth information about the reported numbers of the companies. This rich data can be effortlessly fed directly to your spreadsheets through iConnect which facilitates easy extraction of data and comparison across companies, literally at the click of a button.
The following extract of iConnect for the same 5 companies will help you understand how this is done.
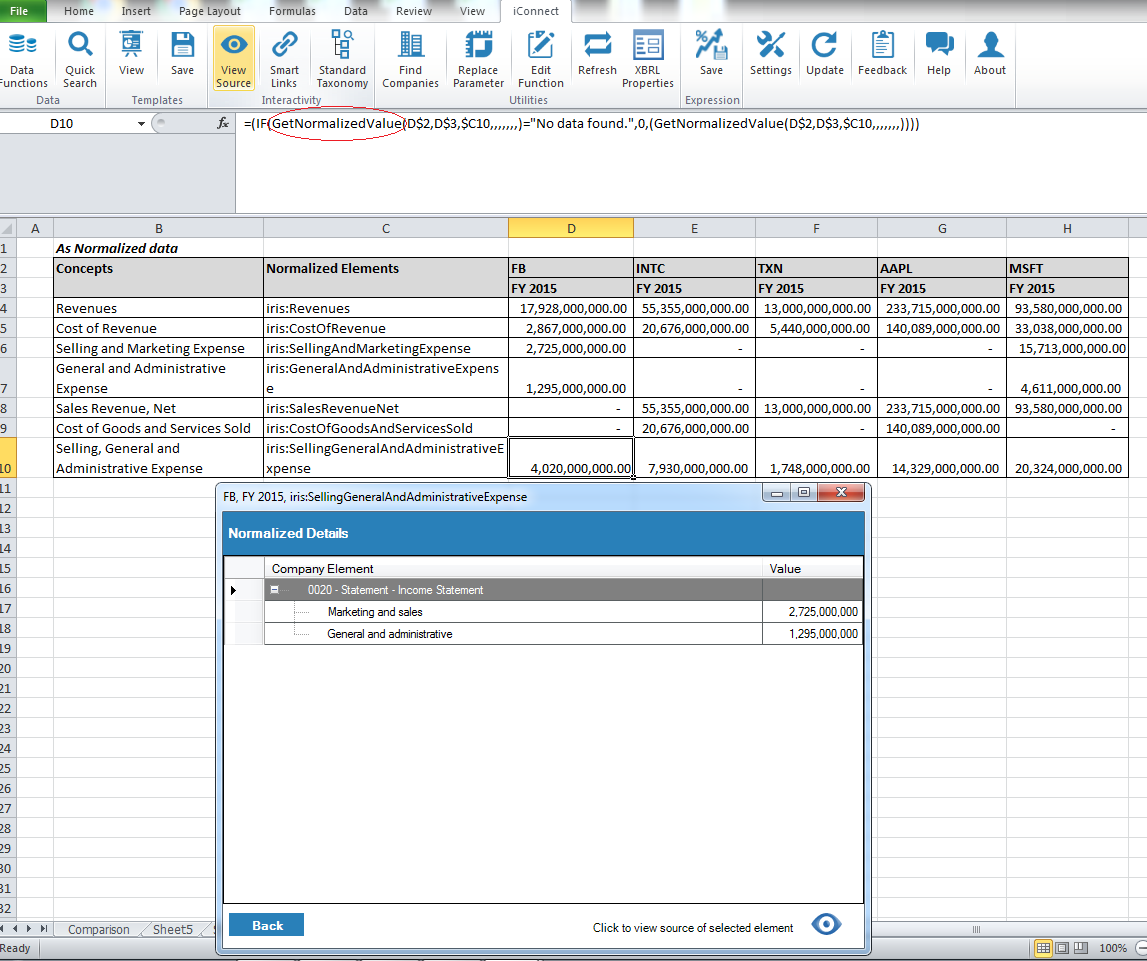
Table 3: Extract from iConnect of Normalized Data Sets
As you can see, the normalized data in iConnect has all the values from the reported data of the companies. Additionally, there are derived values for Revenues, Cost of revenues and Selling, and general & administration expenses which help standardization and easy comparison across companies. Not only this, but the application also provides details of normalization as shown in the image above. Here, the application shows that the Selling, general and administrative expense is derived by adding the company-reported values for Marketing and Sales and General and administrative expenses.
Further, the application also helps analysts refer back to the source document filed with the SEC, simply by clicking on view source for any value. iConnect, due to the underlying normalized taxonomy, takes away the pain of standardizing data and lets you concentrate on real analysis. It empowers you to make meaningful comparisons across companies without having to do it in a manual, effort-intensive manner.
iConnect also helps in handling company extensions.
iConnect is an MS®Excel® based add-in that provides you access to a repository of publicly available XBRL data that you can download directly into spreadsheets. With iConnect, you can focus on analyzing financial data rather than aggregating it from disparate sources. The application also allows analysts to add textual commentary to any report to provide additional insight and guidance.